Introduction
“Oh no!” Kaitlyn shouted, forgetting to use her inside voice.
“My house is flooded!” Gianna chimed in.
“Why didn’t I see this coming?!” Sophia exclaimed in horror, as their group broke into fits of laughter.
My 5th graders were using physical models to understand how Earth’s systems interact with each other. In fast-forward, they saw melting glaciers raise the level of the ocean causing coastal flooding, helping them internalize cause-and-effect in the natural world. This was one activity in a two-week series of lessons within our Earth’s Systems Unit.
The week prior, the learners had been introduced to Earth’s systems: atmosphere (air), hydrosphere (water and ice), geosphere (land), and biosphere (plants and animals, including people). See NGSS Lead States 2013 (5-ESS2.A). The class had divided into four “Expert Groups,” one for each system. They researched their system, using “boxes and bullets” note-taking in their science notebooks (main idea in the box, with bulleted supporting details and examples underneath). Their purposeful reading helped them answer two basic questions: “What is the system (and its components)? How does it move and change?” (NGAC and CCSSO 2010). Each group transformed their words into a beautiful drawing of their system on poster-size paper, and presented their findings to the rest of the class. They added more specific examples of each system’s components when we went outside and noted evidence of the natural world in which we live, categorizing their observations by system. Now it was time to begin exploring how the systems affect each other.

During the following week I focused on helping my students internalize the three-dimensional learning outlined in NGSS’s Earth’s Systems Unit. See Sea Level Rise Lesson Enduring Understandings Aligned with NGSS. See NGSS Table.
Mindful of the Bybee’s 5E lesson format (Bybee 2014), I began the lesson activating background knowledge of Earth’s systems; teasing out what the learners already knew about air pollution; and raising questions that would get them thinking about how people (part of the biosphere) affect the atmosphere, and the possible results. Using physical models, the learners then explored one related cause-and-effect chain documented by scientists – sea level rise (CU Sea Level Research Group 2015). Using a multimodal approach, including questions, discussion, research, drawing, photographs, video, and student sketching, over the next few days I was able to help my students appreciate the interconnectivity of Earth’s systems, and the powerful affect one system can have on others.
Before class, I gathered the materials needed for modeling systems interactions. See Materials for Sea Level Rise Lesson Using Models. Six models were set up around the classroom when the students arrived.
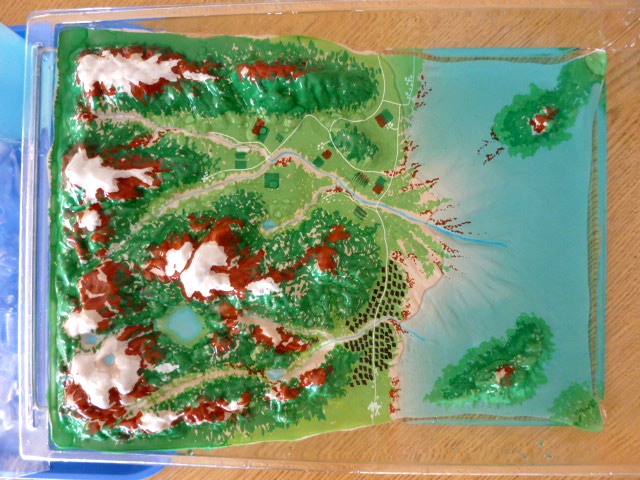
I used plastic “water cycle” models purchased from Amazon.com. I drew black “roof tops” to indicate where people lived, and then filled the “ocean” with water and food coloring.
Engage
The lesson began with the children sitting on the rug near their science partner (away from the models). Children who struggled academically were paired with stronger students. To engage the learners, activating prior knowledge, and getting them thinking in the direction of the enduring understandings for this lesson, I asked questions about system interaction. See Leading Questions to Engage and Focus Learners. The children discussed the answers with their partner before a few volunteers shared their information with the whole class. As I listened in on conversations, I made note of misconceptions that would be addressed later in the lesson.
“Today you’re going to take a look at how air pollution in the atmosphere is affecting the other systems. I have models set up for you because using a model is a way to help us understand an important idea,” I explained. “When you’re talking about something really big, such as the entire planet, you need to take just a piece and make it smaller, so you can see it. You’re also going to see a scientific phenomenon that usually happens very slowly over many years move and change right before your eyes within a few minutes. Compacting time and space can help you better understand a concept. These models will help you understand how Earth’s systems interact.”
Explore
I showed the students a picture of a town in Norway, one that looks similar to the models, with mountains behind this coastal town on the edge of the ocean.
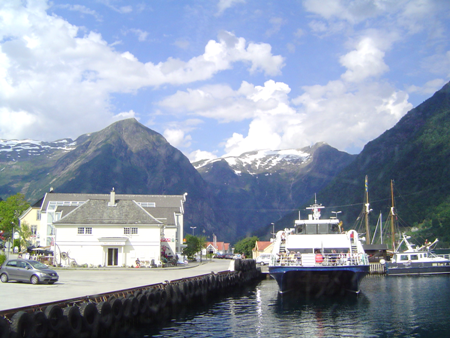
This is a town I visited while in Norway.
I asked what similarities they saw between the photo of a real place, and the models in the classroom. I left this image on the Smartboard as the children moved to their models. Students who would need help were grouped with stronger students who could offer support.
Gathered around each model coastal town, the students used their imagination to get “inside this world”. Each child chose a house (black rectangle on the model), and discussed with their group what it was like to live there. “What do you see when you’re inside your house looking out the windows? Why do you like living there?” This is an important step to activate the children’s imaginations, and encourage them to develop some emotional attachment to “their home”.
After a few minutes, I told the class they would be able to make their miniature world more realistic by putting ice on top of the mountains, since tall mountains are often covered by snow and ice year ’round, even through the summer. One helper in each group collected a Zip-Loc bag of ice.
Each group lay the bottom of the bag of ice across the top of their mountains. I asked one volunteer to hold up the picture of the sun. “What does the sun give our Earth?” (Light, heat, energy.) Another volunteer held up the picture of a power plant, as another traveled around the room waving the black streamers. “These streamers represent the pollution in our atmosphere. The biggest polluters are the power plants that burn coal to generate electricity for us. Over the past 200 years, the number of people living on the planet has increased dramatically. So what do you infer about the amount of electricity used? So what’s happening to our atmosphere?” (Air pollution has increased dramatically.) Two more volunteers with streamers joined the first. “What else causes air pollution?” (Cars, factories, etc.) “The air pollution is trapping the sun’s heat in the atmosphere near Earth. This is causing the whole planet to get warmer.” Looking at their model, the learners predicted what would happen to the hydrosphere as Earth continues to warm.
“It’s not a big change. We might not be able to feel the increase in air temperature; but the ice is reacting to it, the ice up in the mountains, and the ice in the Arctic and Antarctic. Some of the land ice that used to stay frozen all the time is now melting. This is happening in the world now, but it’s happening very slowly.”
I explained that since we had a limited time for our science class, just 40 minutes, we would have to speed up the process in our model so we could see the effects in a short amount of time. Computer models do the same. They show hundreds of years of change in just a few seconds.
A helper from each group collected a half-cup of warm water. “Some of the ice back in the mountains has already begun melting. You can show this by slowly pouring the water into your bag of ice.” Making sure that the bottom of the bag (with the holes) stayed on top of the mountains, each group poured the water into the bag of ice.
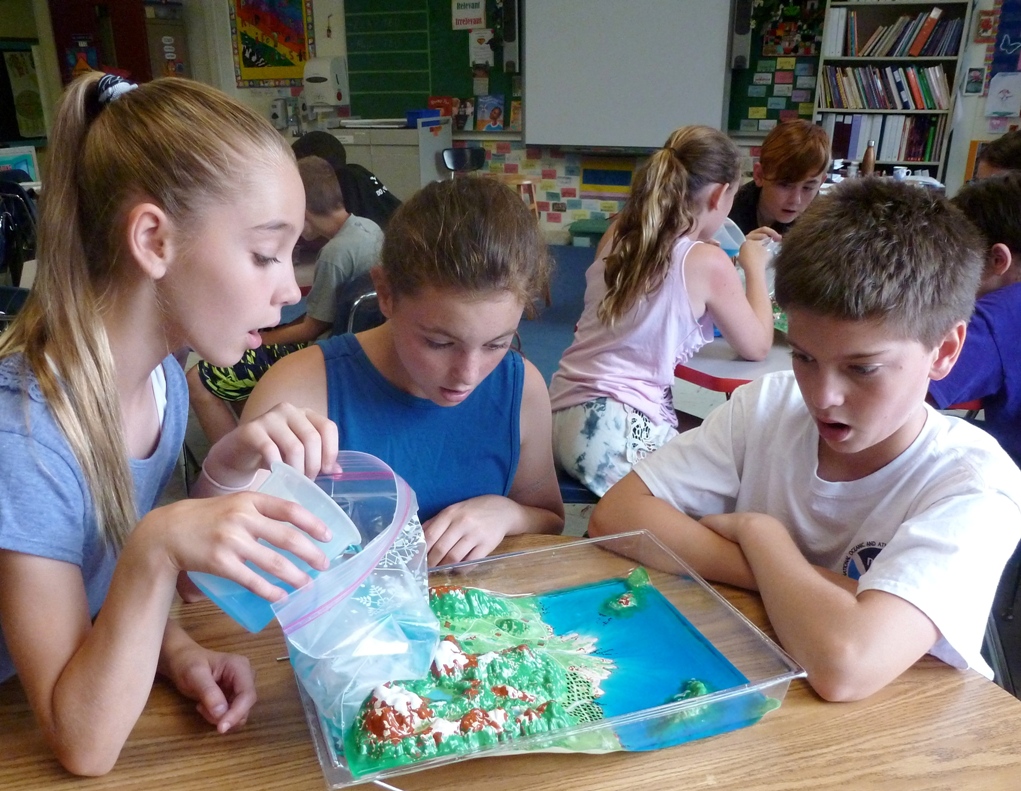
Students pour warmed water onto the ice in the bag.
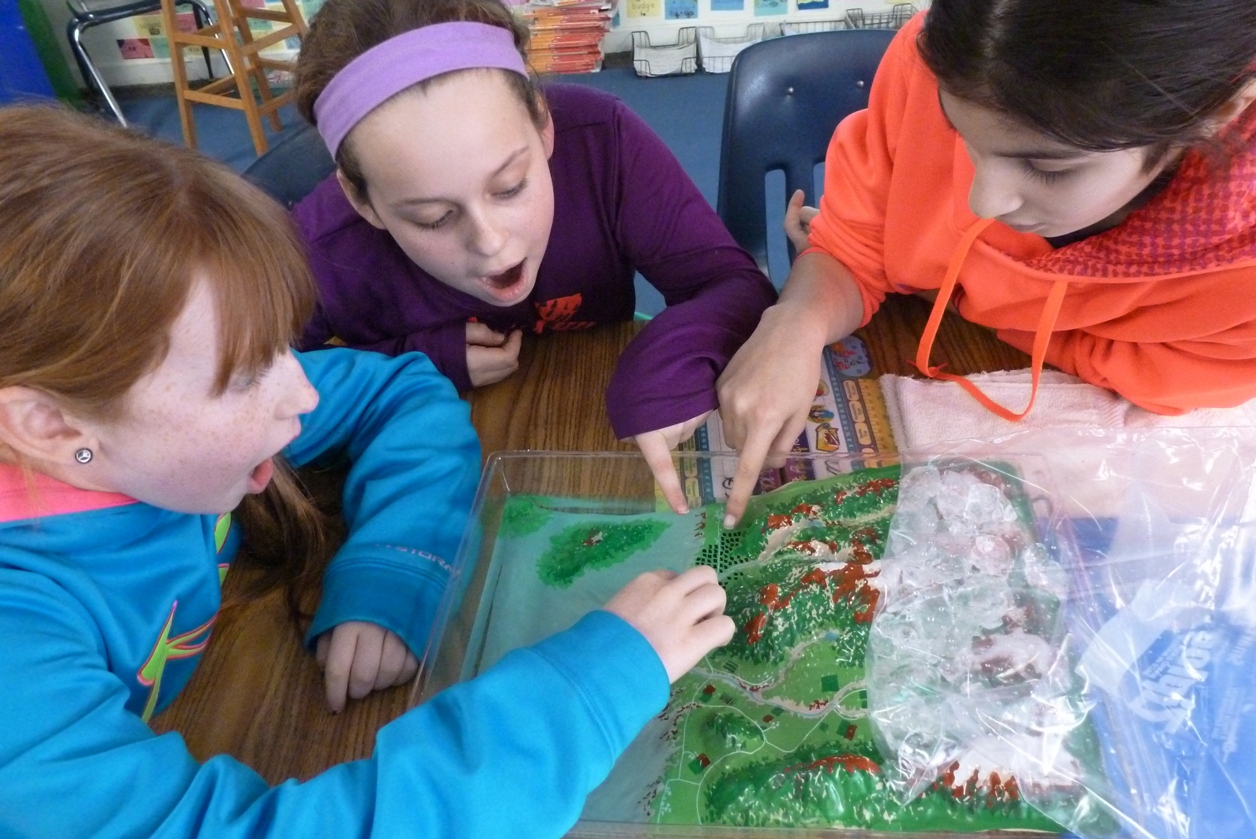
This caused additional melting. The water flowed out of the holes in the bottom of the bag, down the mountains, and into the ocean. The ocean level began to rise. The children quickly realized that their homes were about to be submerged.
Excited voices filled the classroom as the students saw what was happening to their town. On the one hand they were horrified. On the other hand, they knew it wasn’t really happening to them. They laughed as they saw the whole town flooded, and at the same time complained that it shouldn’t be happening. Every student was totally engaged.

When the “glacial ice” melts the sea level rises, causing flooding of coastal areas.
As I circulated around the room, I listened to conversations, and asked groups what had happened within their miniature world and why, noting misconceptions that could be addressed during class discussion. To help students clarify their thinking, I asked them to draw in their science journals a flow chart, a cause-and-effect sequence showing the chain of events, and to identify which Earth’s system was being affected each step of the way.
Explain
Although the simulation happened quickly, the learners had witnessed multiple steps in the sequence of events from increased air pollution to the flooding of a town:
- People pollute air more and more (biosphere affects atmosphere).
- Increasingly, the sun’s heat is trapped in the atmosphere by the pollutants in the air (atmosphere).
- Increasing air temperatures melt land ice (atmosphere affects hydrosphere).
- Melting land ice raises the ocean level (hydrosphere).
- The ocean floods land and houses (hydrosphere affects geosphere and biosphere).
Gathering the children on the rug, I asked them to explain what had happened, working backwards: “Why did the town flood? Why did the sea level rise?” etc. I reminded them that this was a working model of the real world. “What do you think is happening in the real world? Why?” They also reversed their thinking, examining their flow charts from the beginning (people causing air pollution) to end, filling in gaps in their notebooks. Partners then reviewed the entire sequence again, this time using scientific terminology (biosphere affects atmosphere) and checking each other’s notebooks.
Elaborate
The next day I helped the learners apply what they had seen in the model to the real world. I showed pictures of coastal cities around the world (Manhattan, Hong Kong, Cape Town, etc.), and showed them a news clip about rising sea levels. I asked them to predict what could happen if this pattern continues. “What will happen to businesses, and to people, if the ocean level rises several meters?” The students understood that lives would be disrupted from flooding, and areas would become uninhabitable, that people would need to move away from the coasts.
Taking it a step further, I asked, “What about people who don’t live near the ocean? How will they be affected by sea level rise?” I helped the children understand that if businesses, oil refineries, power stations, crop fields, are flooded it affects the lives of everyone. In addition, as people are displaced, other areas become more crowded. I emphasized that the ocean’s levels are rising very slowly in most areas, ~3 mm/year globally (CU Sea Level Research Group 2015), but it’s important to begin planning now because it adds up over time. The children identified the height of 3mm on a ruler; then the height after 10 years, after 100 years, to allow them to understand the scale of change (5-ESS2-2).
The students used their flow chart to draw a sequence of cartoon panels: air pollution to ocean flooding. It was a good review for them, and it helped me to see who still needed help.
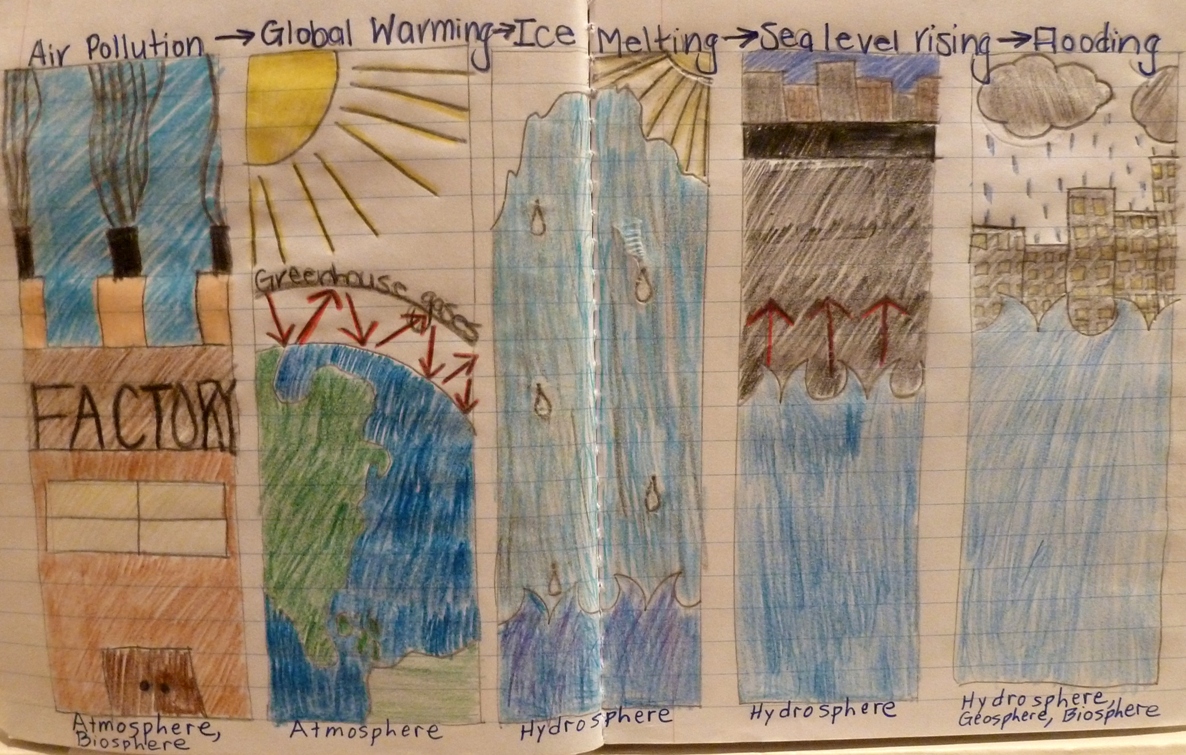
Cartoon panels indicate understanding of cause and effect, air pollution to coastal flooding.
The following day, I distributed a sheet of probing questions to encourage more thoughtful discussion. This time there was one member from each Expert Group gathered into a group of four. I was impressed by the amount and depth of discussion in these talk-to-learn groups. See Digging Deeper.
The next day, I explained that if we understand how Earth’s systems affect each other we can begin to design solutions. “What’s causing the ocean to rise?” The children worked backwards through their sequence charts to the very beginning. “Since we understand that air pollution is the cause, what’s the solution?” I wrote the children’s ideas for reducing air pollution on a chart. I told them that the good news is that many adults are taking steps to reduce air pollution, but they also need kids’ help. The children researched on the Internet ways kids could reduce air pollution (see Kids Against Climate Change), and added ideas to our chart. They talked about taking action at home as well as at school. To disseminate their ideas we created an Animoto video we hope will inspire other children to take action to help Planet Earth.
Evaluate
Formative assessment took place throughout the lessons. As the students collaborated, sketched, and wrote descriptions about the systems affecting each other, I circulated around the room, listening in on conversations, asking questions about what was happening and why, and taking notes on student misconceptions, as well as insights. These were addressed individually, with small groups of children who demonstrated a common need, or during whole class discussions. At the end of the second week, the summative assessment, a multiple choice quiz, reflected the enduring understandings for this unit.
Conclusion
The overarching goals of this series of lessons within the Earth’s Systems Unit were to get my students thinking about how the systems interact with each other, and to help them understand that people can affect Earth’s systems. I highlighted air pollution and resulting sea level rise because it’s one of the most important issues of our time, and educators are in a position to help by teaching children these scientific principles.
I used the 5Es for this lesson series spread over two weeks, as recommended by Bybee for optimal learning (Bybee 2014). Further, using a multimodal approach to teaching encouraged the learners to internalize the enduring understandings related to NGSS’s Earth’s Systems Unit for 5th graders.
Recently I was invited to the White House’s Back-to-School Climate Education Event. Dr. Kathryn Sullivan, head of NOAA (National Oceanic and Atmospheric Administration), encouraged us educators to help our students understand the “dynamics of our planet,” how they impact people now, and how they’ll continue to do so in the future. Teaching to NGSS’s Earth’s Systems Unit sets our course to do just that.
Additional Information for Teachers
See Kids Against Climate Change for a student-inspired website where kids can talk to each other about climate change issues and ideas. It also provides an authentic audience to encourage students to pay attention during science class.
See Challenge Activities for Students for students who want to learn more about sea level rise.
See Background Information for Teachers for important conceptual information before teaching this lesson.
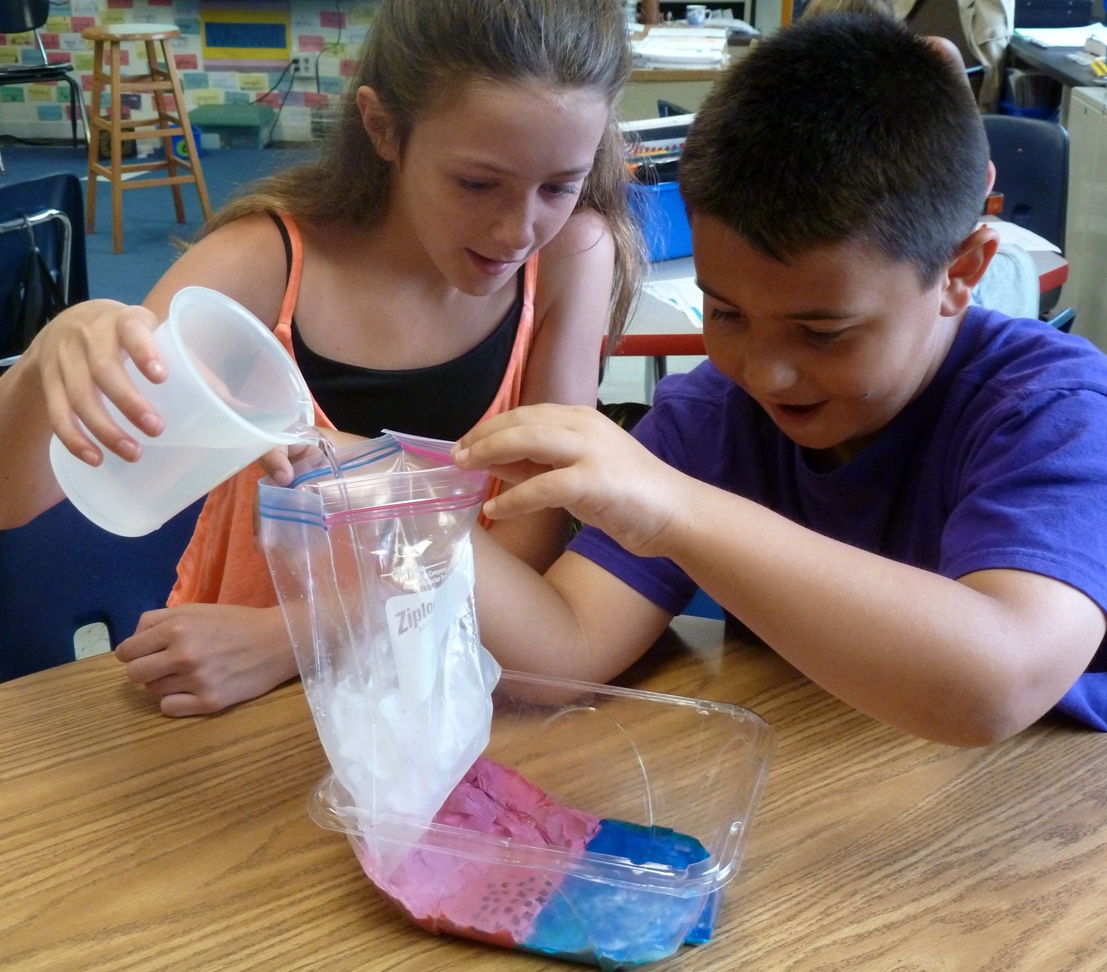
Students made a model coastal town with mountains, flat coastal area, and a depressed area for the ocean.
Students can make a model coastal towns out of clay and a plastic salad container, rather than purchasing models. Plan an extra class period if students are to make their own models.
Kottie Christie-Blick
NOAA Planet Stewards Educator
Distinguished Fulbright Teacher
5th Grade Teacher, Cottage Lane Elementary School
Kottie Christie-Blick, along with colleagues Jacob Tanenbaum and Samantha Levine, will be presenting presenting a hands-on workshop, “Climate Science: How Can Such a Serious Topic Be So Much Fun?!” at the 2016 NSTA Conference in Nashville.
References
Bybee, R. 2014. The BSCS 5E Instructional Model: Personal Reflections and Contemporary Implications. Science and Children 51(8): 10-13.
CU Sea Level Research Group, University of Colorado. 2015. http://sealevel.colorado.edu
NASA Global Climate Change. 2015. Warming Seas and Melting Ice Sheets. http://climate.nasa.gov/news/2328
National Governors Association Center for Best Practices and Council of Chief State School Officers (NGAC and CCSO). 2010. Common Core State Standards. Washington, DC: NGAC and CCSO. http://www.corestandards.org/
NGSS Lead States. 2013. Next Generation Science Standards: For States, by States. Washington, DC: National Academies Press. www.nextgenscience.org/next-generation-science-standards
Internet Resources
Kids Against Climate Change. https://kidsagainstclimatechange.com/
Ms. Christie-Blick’s Climate & Weather Resources for Kids and Teachers. https://kidsagainstclimatechange.com/start-learning/
New York Times. 2015. How to Save a Sinking Coast? Katrina Created a Laboratory. www.nytimes.com/2015/08/08/science/louisiana-10-years-after-hurricane-katrina.html?emc=eta1&_r=0
Purchasing Supplies
You can purchase the Water Cycle Models from American Educational Products. Use Amazon.com for a better rate.