The “Tower of Books” Library Challenge began January 25, 2016 and ended Friday, March 18, 2016. Second grade classes were challenged to collectively read 100 books from predetermined categories, first grade, 80 books and kindergarten, 60 books. Many classes met the “Tower of Books” Challenge with the required number of categories and books while other exceeded the challenge! Congratulations!
This week in library kindergarten, first and second graders will collect, count and compare the recorded data from all participating classes.
;
With a a partner kindergarten and first grade students will count, tally and record the number of books read per class. Students will then visually determine which of the classes read the most books.
Second grade students will focus on entering the data collected by the kindergarten and first grade students to a Google Spreadsheet. The data will be contained in two columns of the spreadsheet; the first column contains a label or teacher’s name, and the second column contains a numeric value or the number of books read. Students will then analyze and determine who was the OVERALL winner in each grade level.
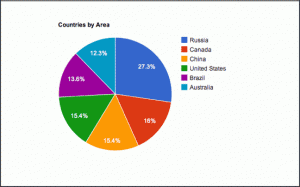
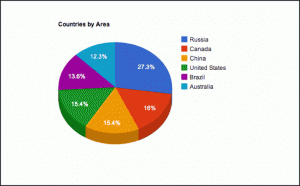
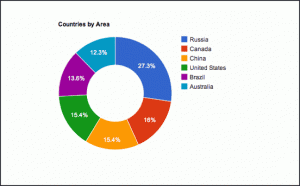
Using the data entered into the Google Spreadsheet, second grade students will learn how to create pie charts. A pie chart or a pie graph, allows you to visualize data as “slices of pie,” or proportions of a whole. In the Chart types tab of the Charts Editor dialog, you can switch between the 2D and 3D versions of the pie chart, or turn a pie chart into a donut chart.
 2D Pie Chart |
 3D Pie Chart
|

Donut Chart |
Students may choose to compare grades, specific classes within a grade or classes of their choice. Students will also be able to display the data in a number of different ways using the various charts available in a spreadsheet. Watch the tutorial below.
